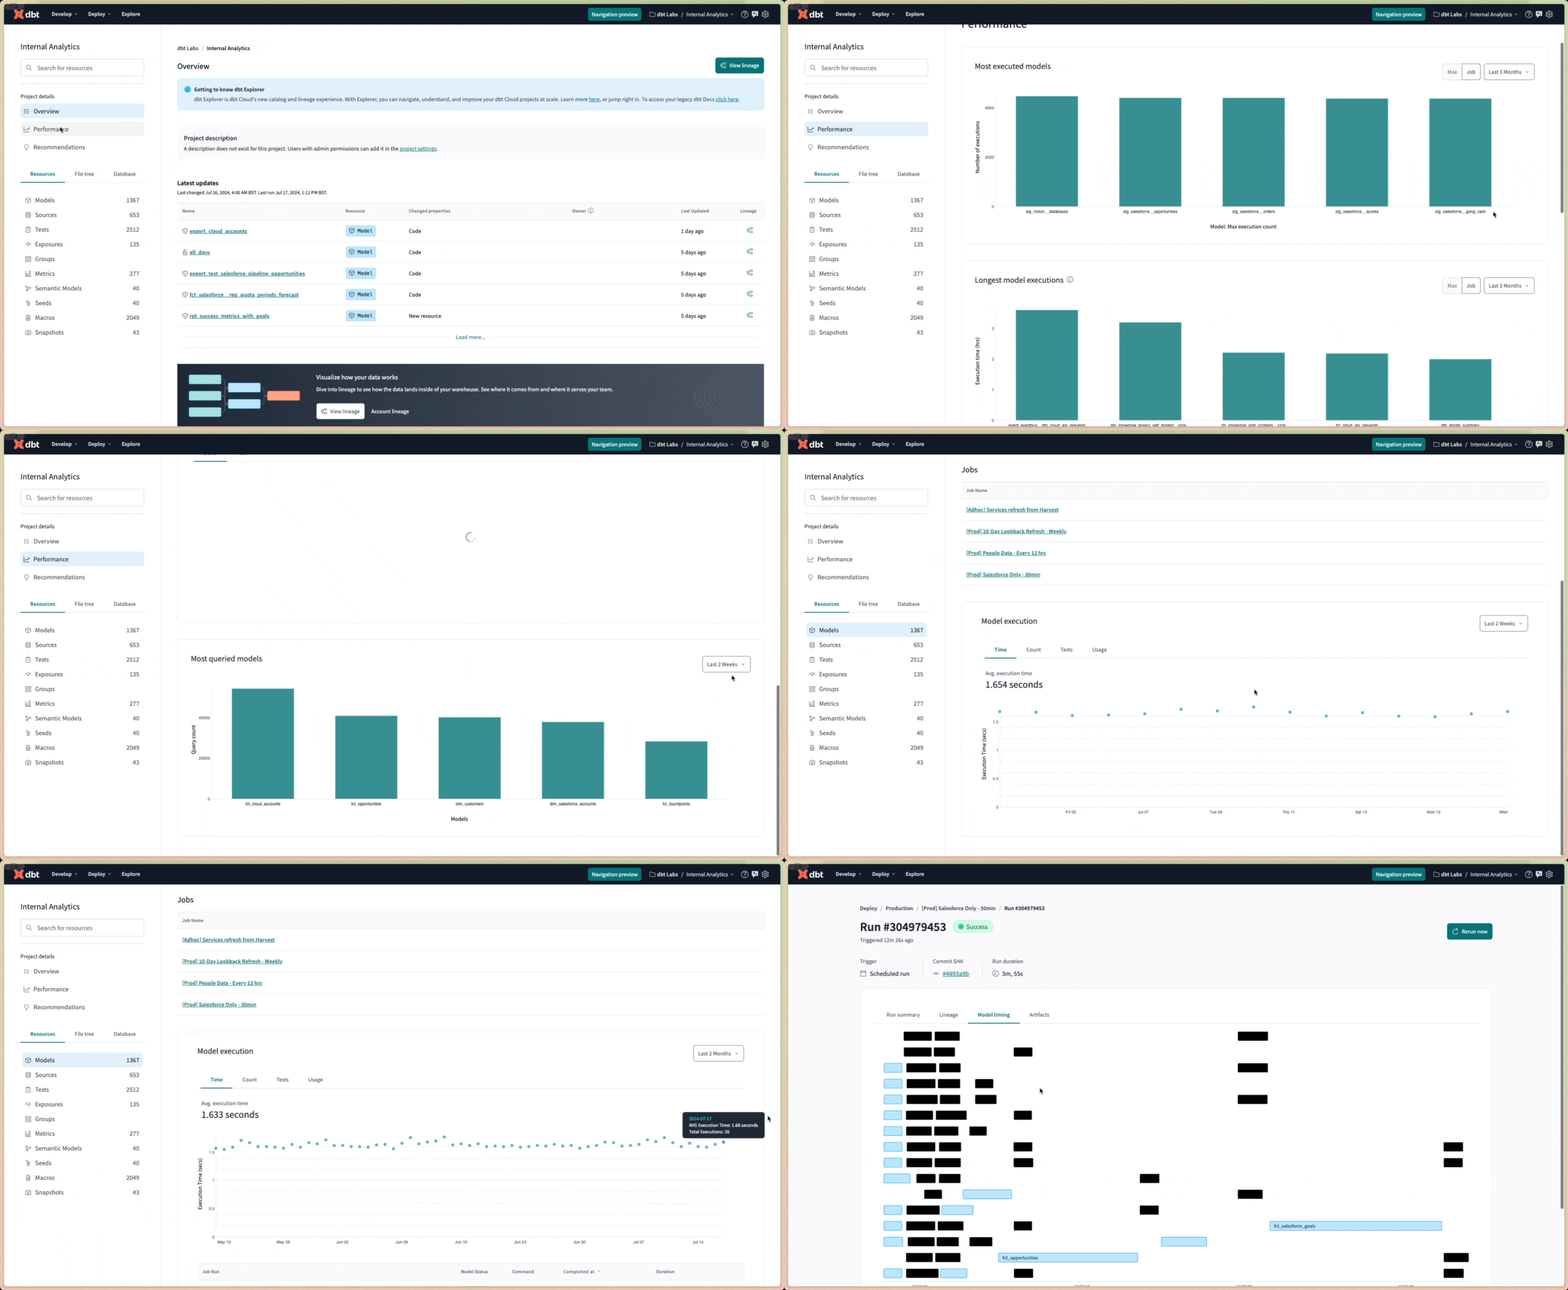
Model performance
dbt Explorer provides metadata on dbt Cloud runs for in-depth model performance and quality analysis. This feature assists in reducing infrastructure costs and saving time for data teams by highlighting where to fine-tune projects and deployments — such as model refactoring or job configuration adjustments.
If you enjoy video courses, check out our dbt Explorer on-demand course and learn how to best explore your dbt project(s)!
The Performance overview page
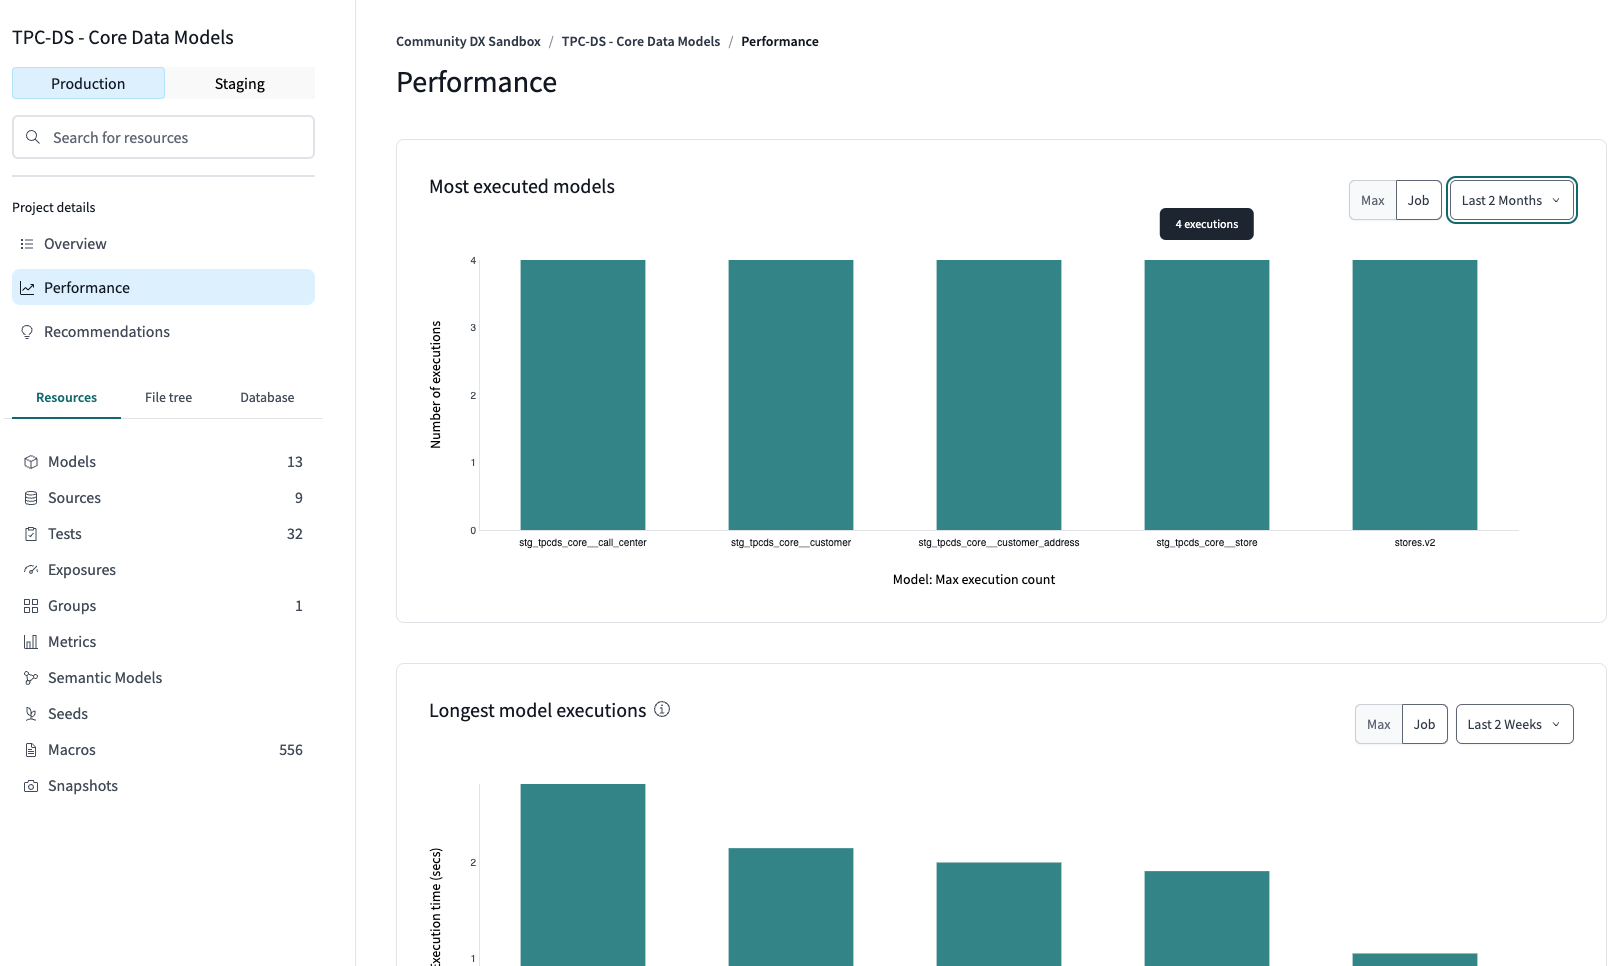
You can pinpoint areas for performance enhancement by using the Performance overview page. This page presents a comprehensive analysis across all project models and displays the longest-running models, those most frequently executed, and the ones with the highest failure rates during runs/tests. Data can be segmented by environment and job type which can offer insights into:
- Most executed models (total count).
- Models with the longest execution time (average duration).
- Models with the most failures, detailing run failures (percentage and count) and test failures (percentage and count).
Each data point links to individual models in Explorer.
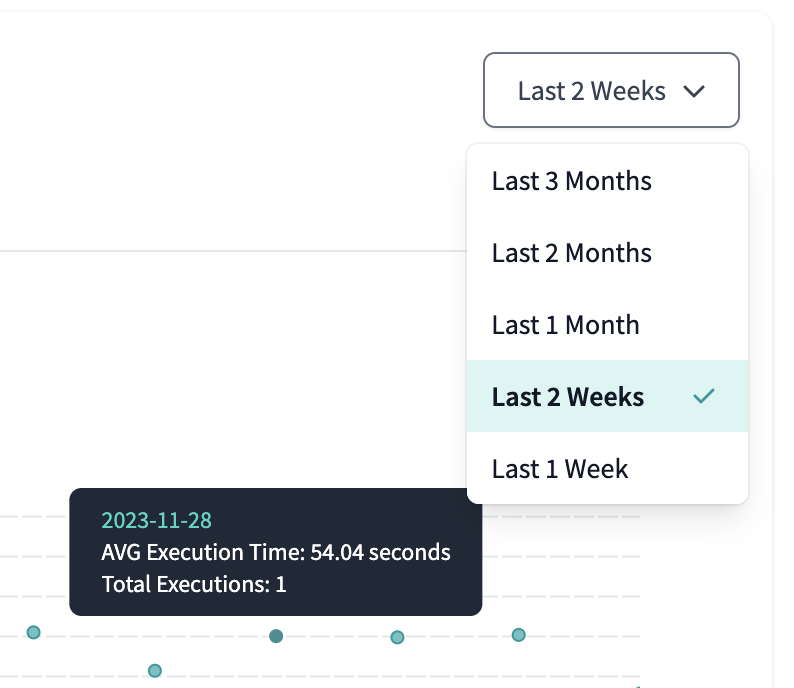
You can view historical metadata for up to the past three months. Select the time horizon using the filter, which defaults to a two-week lookback.
The Model performance tab
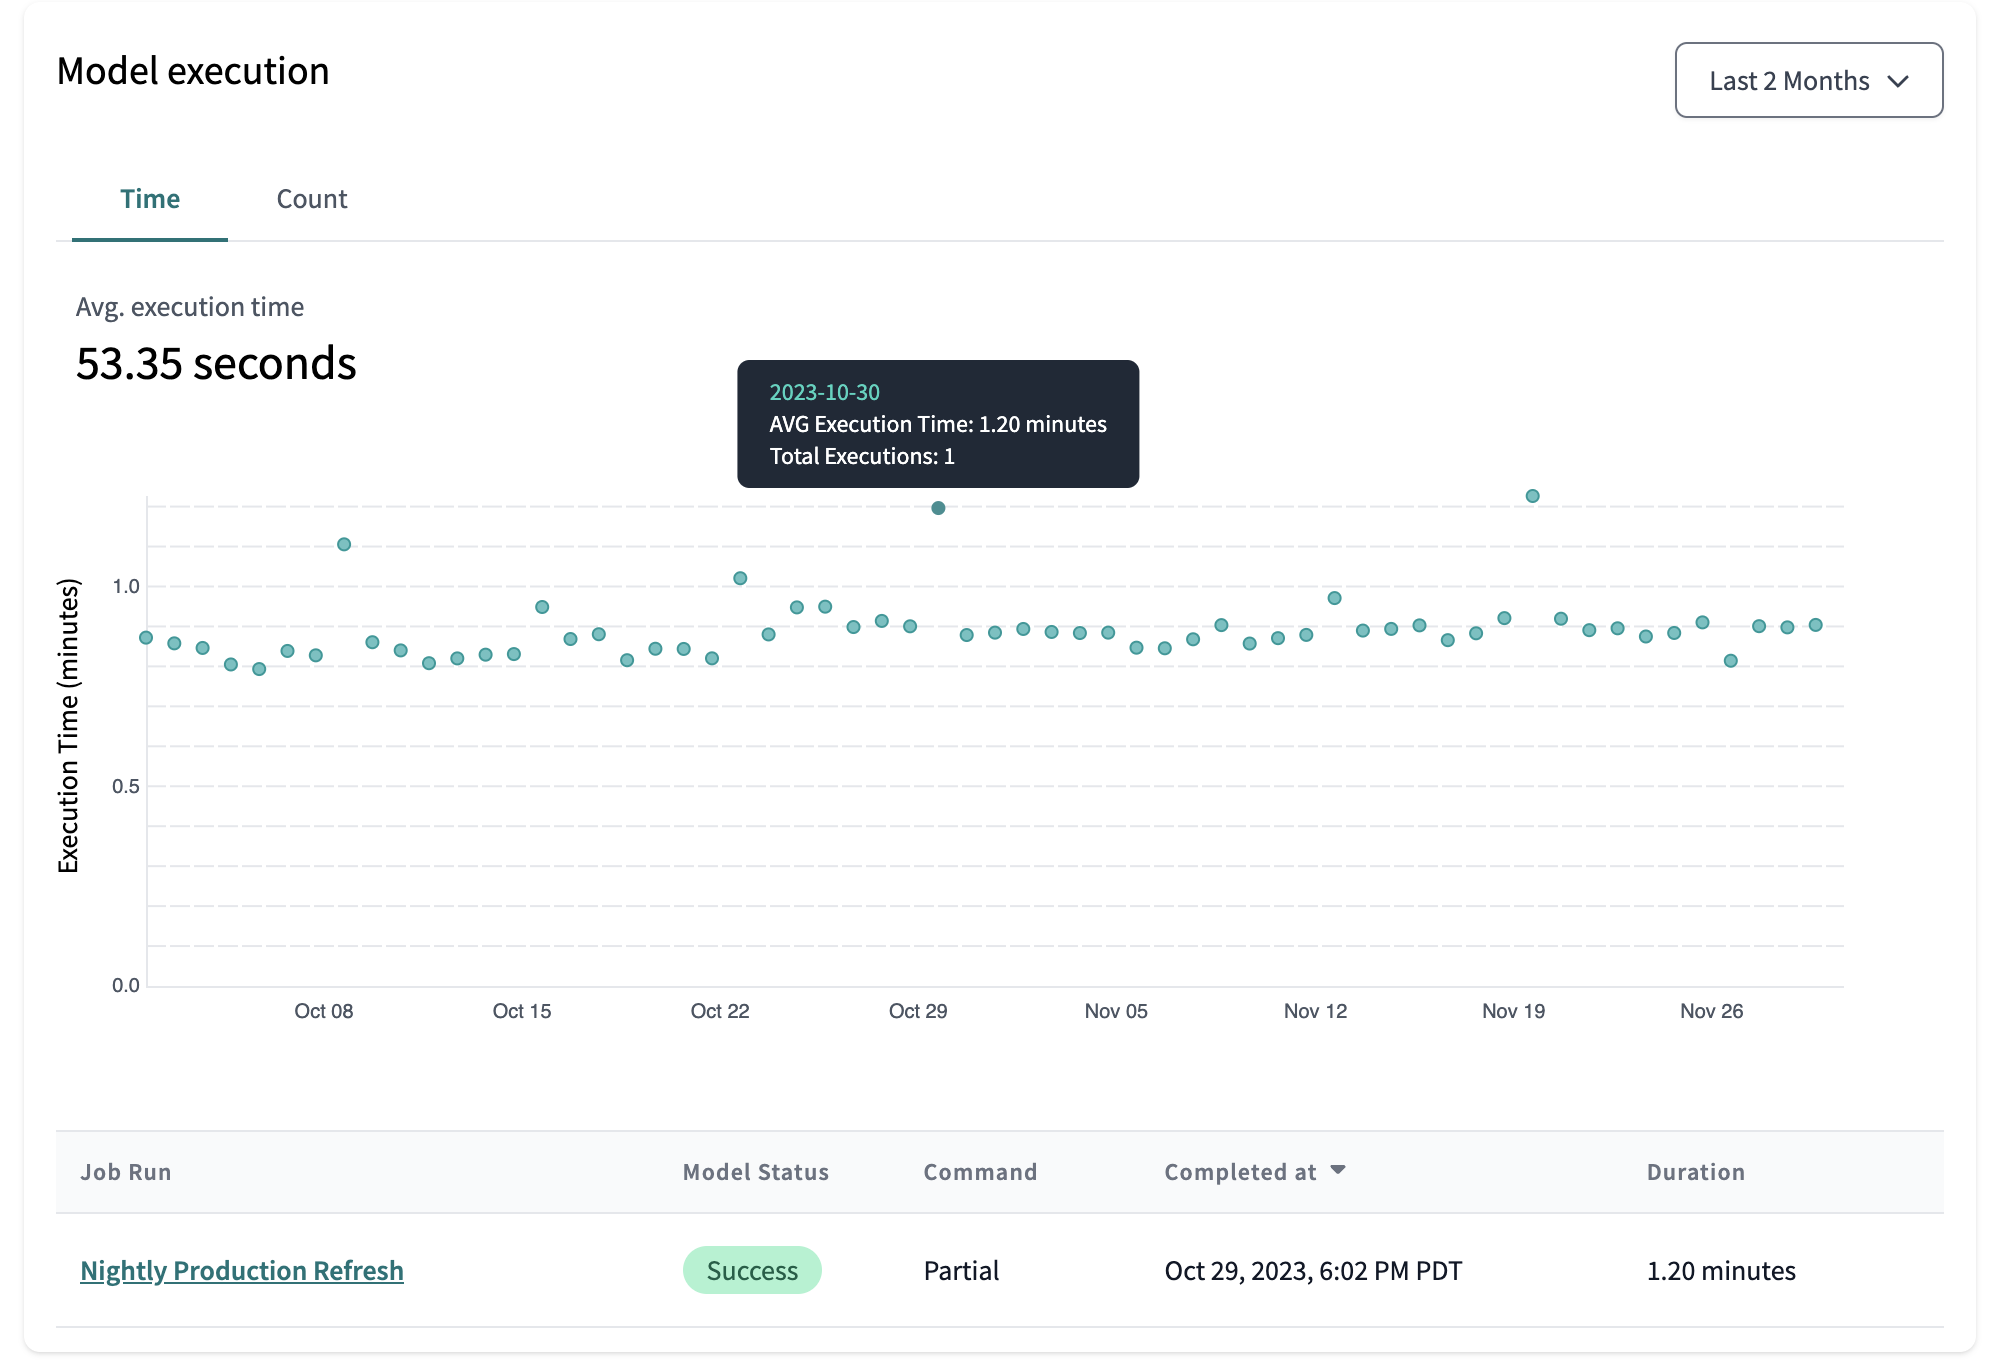
You can view trends in execution times, counts, and failures by using the Model performance tab for historical performance analysis. Daily execution data includes:
- Average model execution time.
- Model execution counts, including failures/errors (total sum).
Clicking on a data point reveals a table listing all job runs for that day, with each row providing a direct link to the details of a specific run.


